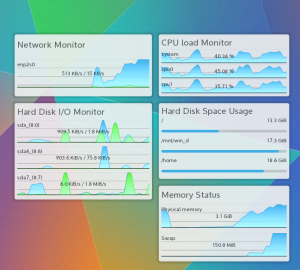
In Plasma 5.3 some of the things that were lost along the way of the port to Plasma 5 due to the massive architecture change will be back.
Today just got back the system monitor widgets, that helps keeping an eye on the CPU load, disk usage, network traffic and so on.

Along the widgets, a nice reusable component to plot graphs is available to use:
import org.kde.kquickcontrolsaddons 2.0 as KQuickAddons
KQuickAddons.Plotter {
    id: plotter
    dataSets: [
        KQuickAddons.PlotData {
            color: firstcolor
        },
        KQuickAddons.PlotData {
            color: othercolor
        }
    ]
}
Then, (this will vary depending how your data source is implemented) every time a new data set will arrive, you can just do
plotter.addSample([value1, value2]);
You can have as many graphs painted together in the same plotter, depending how many KQuickAddons.PlotData you declare inside the dataSets property.


